You can make a difference in the Apple Support Community!

When you sign up with your Apple Account, you can provide valuable feedback to other community members by upvoting helpful replies and User Tips.

Looks like no one’s replied in a while. To start the conversation again, simply ask a new question.

Help to improve inventory spreadsheet

Hello there

I’ve created a simple spreadsheet to manage the small business of my mother. This is a sample of the real one, basically this a IN/OUT inventory. It works with =VLOOKUP and =SUMIF functions in a normal day this works great but I’d like to improve it. Let me explain you that I have to two places in this business (warehouse and a retail shop). Every day I move products from warehouse to retail shop to maintain the stock of products good. So I’m trying to look for a way to know how many products are in retail shop and warehouse separately.

I’ll really appreciate your help, I’m not a really expert in spreadsheet apps every I’ve done is thanks to YT. 😅

MacBook Air (2020 or later)

Posted on Feb 5, 2022 9:54 AM

Reply
Question marked as Top-ranking reply

Posted on Feb 5, 2022 12:44 PM

Two ideas come to mind. The first one is simple but not easily expandable if you, say, open a second retail location and want to know how many items are in each of the two locations.


First idea:


Use a table like shown below to replace your IN and OUT tables, assuming they are equivalent to Bought and Sold. It would have a column for each kind of movement of the product.


For your Inventory summary table you would insert two new columns. You would use SUMIFS to gather the various sums needed for each SKU

Qty in Warehouse = (In to Warehouse) + (Retail Shop to Warehouse) - (Warehouse to Retail Shop)

Qty in Retail = (Warehouse to Retail Shop) - (Retail Shop to Warehouse) - (Out from Retail Shop)


Second idea:


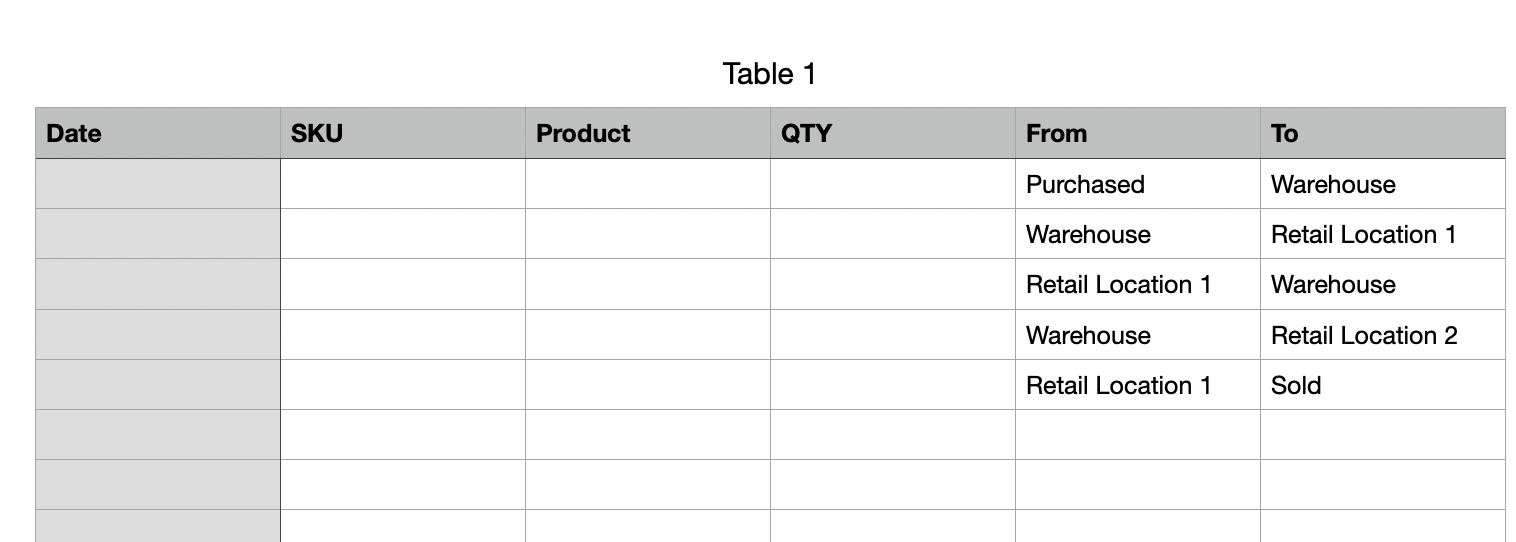
Columns E and F are pop up menus. The popup in E is all possible sources, F is all possible destinations. They are identical popups other than "purchased" and "sold".


QTY in a particular location would be calculated like this (in English not formulaic):

Qty in Warehouse = (sum of qty when column F = "warehouse") - (sum of qty when column E is warehouse)

I can provide the actual formulas if what I wrote above doesn't make sense.


With the first idea you could put more than one activity per line (bought some and also moved some to Retail on the same day, for example). It also makes it easy to see at a glance when you moved things from one place to another because each is in a separate column. But, like I said above, it is not easy to expand. The second idea is easy to expand, you just add a new location to the pop-ups, but it is hard to see at a glance what went where when.

2 replies
Question marked as Top-ranking reply

Feb 5, 2022 12:44 PM in response to Cranmer_CS

Two ideas come to mind. The first one is simple but not easily expandable if you, say, open a second retail location and want to know how many items are in each of the two locations.


First idea:


Use a table like shown below to replace your IN and OUT tables, assuming they are equivalent to Bought and Sold. It would have a column for each kind of movement of the product.


For your Inventory summary table you would insert two new columns. You would use SUMIFS to gather the various sums needed for each SKU

Qty in Warehouse = (In to Warehouse) + (Retail Shop to Warehouse) - (Warehouse to Retail Shop)

Qty in Retail = (Warehouse to Retail Shop) - (Retail Shop to Warehouse) - (Out from Retail Shop)


Second idea:


Columns E and F are pop up menus. The popup in E is all possible sources, F is all possible destinations. They are identical popups other than "purchased" and "sold".


QTY in a particular location would be calculated like this (in English not formulaic):

Qty in Warehouse = (sum of qty when column F = "warehouse") - (sum of qty when column E is warehouse)


I can provide the actual formulas if what I wrote above doesn't make sense.


With the first idea you could put more than one activity per line (bought some and also moved some to Retail on the same day, for example). It also makes it easy to see at a glance when you moved things from one place to another because each is in a separate column. But, like I said above, it is not easy to expand. The second idea is easy to expand, you just add a new location to the pop-ups, but it is hard to see at a glance what went where when.

Feb 5, 2022 2:08 PM in response to Badunit

Thanks for your response, I have to tell that I love your second idea (popup menus), I've just try it in the sample and it works with a little modifications to keep different tables. 🙂

In the Inventory Ledge I used the =SUMIFS function to calculate:

  • Total Warehouse (sum of QTY when "=Warehouse" - sum of QTY when "=Retail")
  • Total Retail (sum of QTY when "=Retail"- sum of QTY sold)
  • Total QTY (Total Warehouse + Total Retail)


P.S.: I'd have to say one more time THANKS 😇

Help to improve inventory spreadsheet

Welcome to Apple Support Community
A forum where Apple customers help each other with their products. Get started with your Apple Account.