You can make a difference in the Apple Support Community!

When you sign up with your Apple Account, you can provide valuable feedback to other community members by upvoting helpful replies and User Tips.

Looks like no one’s replied in a while. To start the conversation again, simply ask a new question.

How do I fill in a color between two lines in a graph in Numbers?

I would like to fill in the space between to lines in a graph I'm making in Numbers, like shown in the image I found on Google below. How would I go about doing this?

MacBook Air 13", macOS 10.14

Posted on Jan 1, 2020 3:02 PM

Reply
2 replies

Jan 3, 2020 7:10 AM in response to kaffekopp

With a 2D Stacked Area you can do something like this:
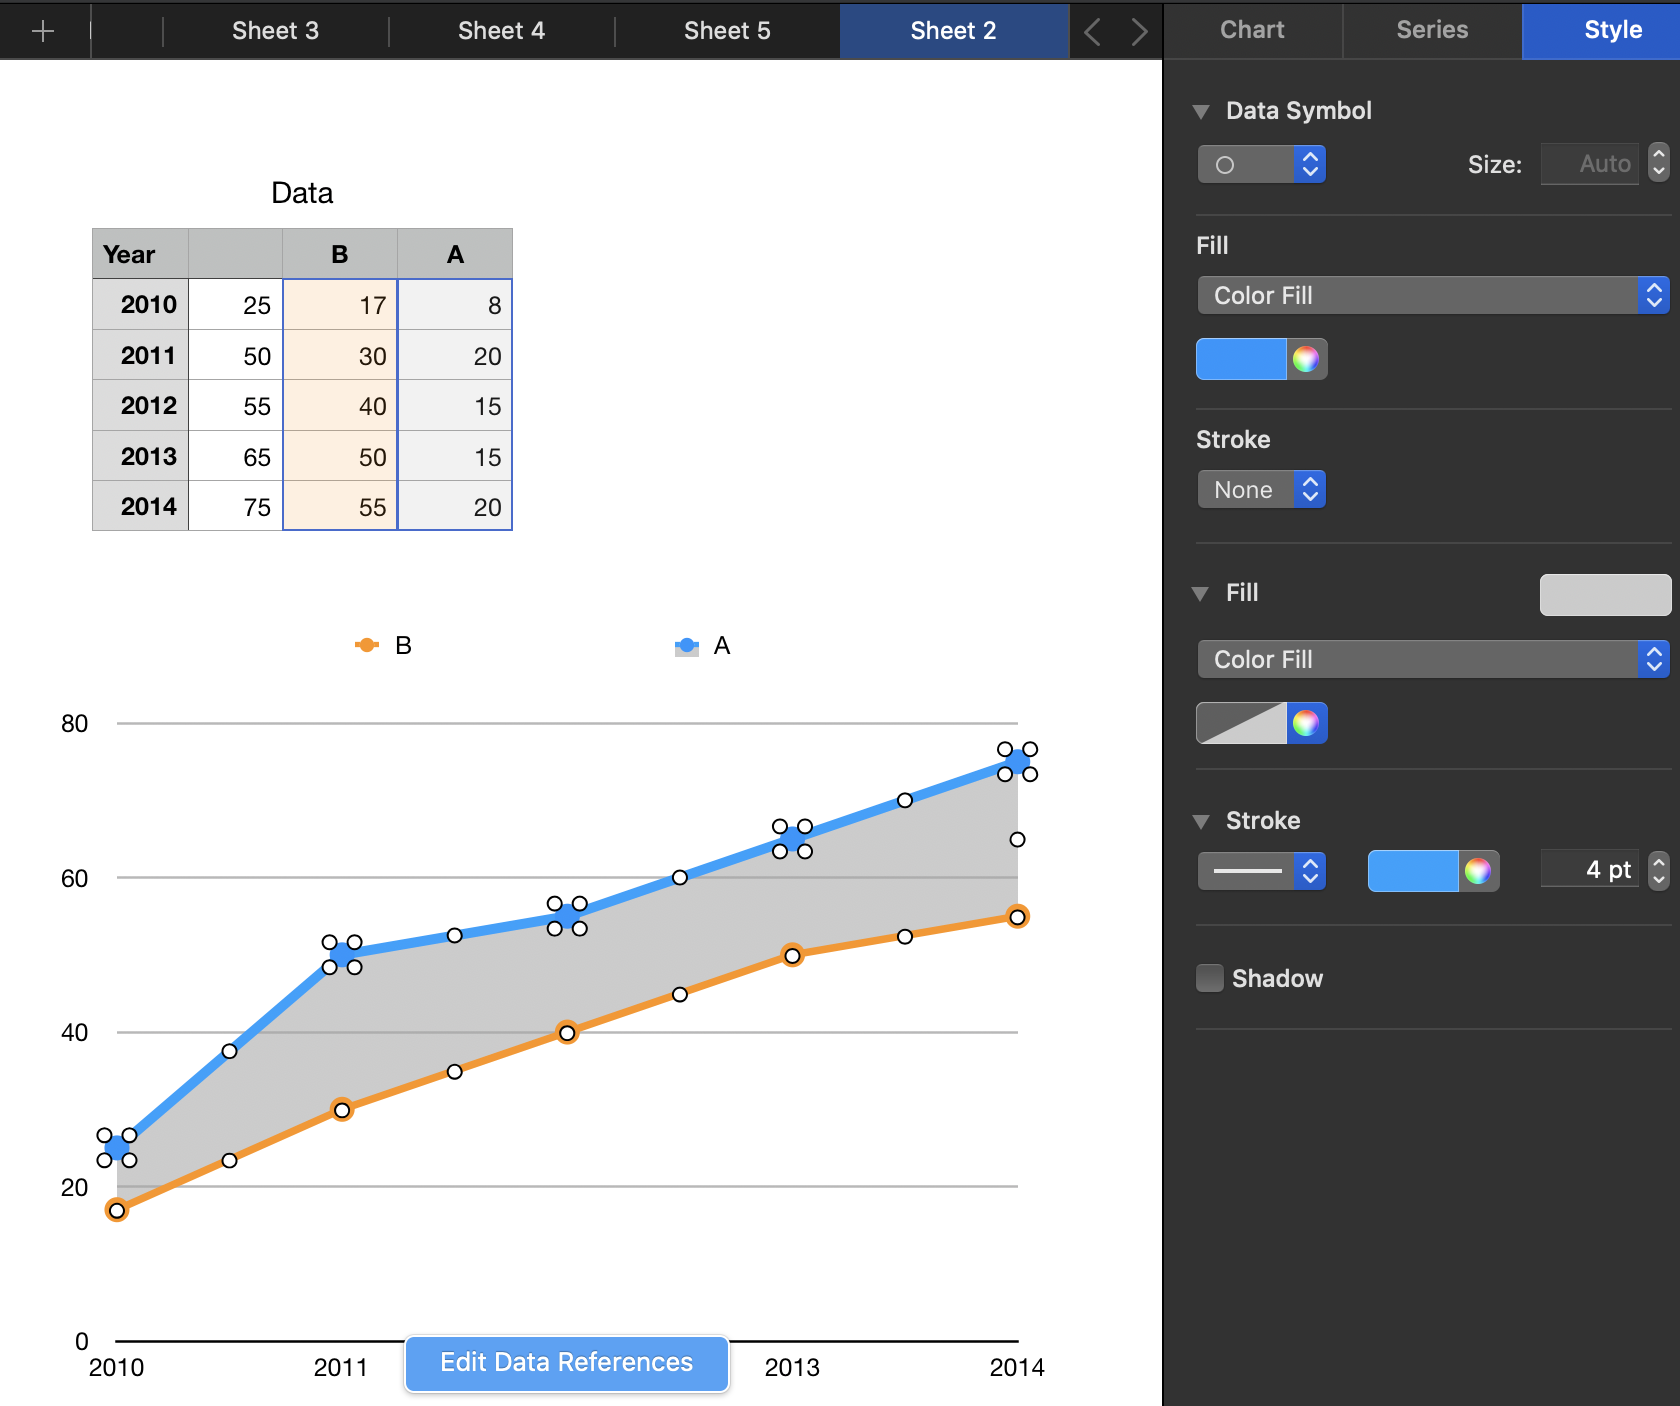


The idea is to add a column in the data table that is the difference between the values of the other two columns.


Select the cells in the data table, Insert 2D Stack Column Chart, click the chart then Edit Data References and remove the reference to the second column in the data table by clicking the column to select it and hitting <delete>.


Then click the chart and use the panel at the right to remove the fill for the first series and widen the stroke, etc., then add the gray fill for the second series and widen the stroke, etc.


It takes some experimenting to see what works.


SG


How do I fill in a color between two lines in a graph in Numbers?

Welcome to Apple Support Community
A forum where Apple customers help each other with their products. Get started with your Apple Account.